Aquaculture and Fish Pond Management Software: A Complete 2026 Guide
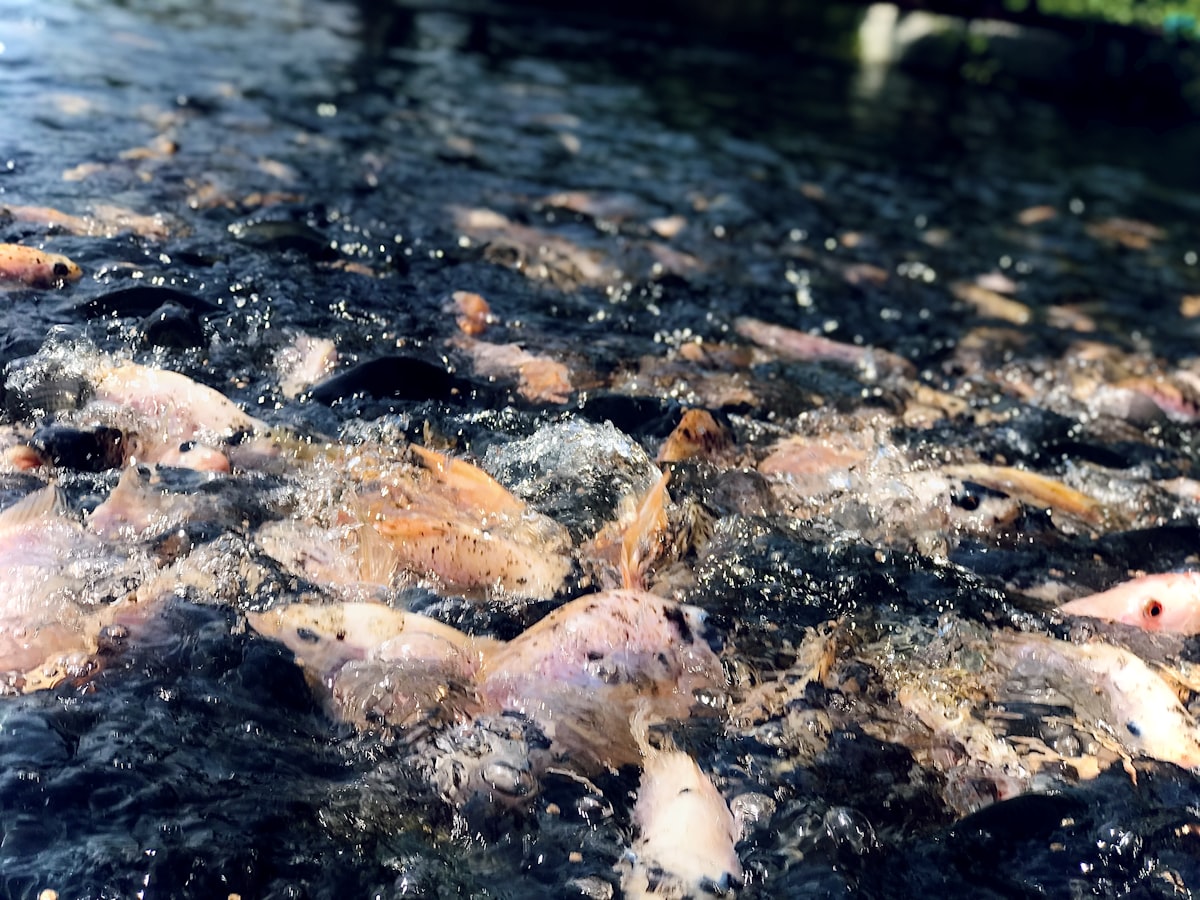
Pak Hendra Kurniawan runs 12 vannamei shrimp ponds in Kalianda, South Lampung, covering roughly 3.8 hectares in total. Every morning and evening, four pond workers walk the site with a pH meter and a DO meter, jotting readings onto a clipboard nailed to each pond's shelter. Feeding schedules are set by habit passed down over years — judged by how eagerly shrimp gather at the feeding tray, plus a rough guess based on stocking age. Nobody really knows how much feed a given pond has consumed in a month, let alone the actual feed conversion ratio (FCR).
The breaking point came one night at pond number 7. The electrical panel powering the aerator paddlewheels tripped without anyone noticing, because the night shift only walked the ponds every three hours. The paper log meant to record dissolved oxygen (DO) got soaked in rain, and part of the handwriting smeared beyond reading. Dissolved oxygen in that pond crashed to 2.1 mg/L for more than four hours with nobody the wiser. The next morning, Pak Hendra found roughly 40 percent of the shrimp in pond 7 dead — about 1.2 tons of market-ready shrimp — with losses from that single pond estimated at Rp 85 million. There was no system to send an early warning when water parameters crossed a safe threshold, and the manual log only told the story after the damage was done.
What is aquaculture and fish pond management software
Aquaculture and fish pond management software is a digital system that records and monitors the entire operational cycle of a fish or shrimp pond — water quality, feeding schedules and consumption, biomass growth, and harvest results — inside one centralized platform accessible from a phone or computer. Unlike the manual approach of whiteboards, notebooks, and a pond supervisor's memory, this kind of system stores data in a structured way per pond and per cycle, so an owner can see the condition of every unit in real time without physically walking every pond. Every water reading, every kilogram of feed dispensed, and every mortality event is logged with a clear timestamp and location, building a history that can actually be analyzed to make faster, more accurate decisions.
The real cost of running a farm without a centralized system
- Mass mortality caught too late — a nighttime drop in dissolved oxygen or a spike in ammonia often isn't discovered until large numbers of animals have already died, because there's no automated alert working around the clock.
- Feed wasted with no FCR control — without clean, per-pond feed consumption records, overfeeding becomes a hidden habit that quietly eats into margins without the owner noticing.
- Water quality data scattered and impossible to analyze — paper logs that get soaked, lost, or piled up in a pond shelter make it nearly impossible to compare pH, salinity, and temperature trends across cycles.
- Harvest decisions based on guesswork, not growth data — without properly logged periodic sampling, harvest timing is frequently off, leading to shrimp or fish harvested too early or too late.
- No easy way to compare performance across ponds and cycles — owners running multiple ponds have no quick way to see which ponds are actually profitable and which keep losing money.
Key features a fish and shrimp farm management app needs
- Per-pond water quality logging with threshold alerts — pH, dissolved oxygen (DO), salinity, temperature, and ammonia are logged per pond, with automatic notifications sent to an operator's phone the moment a parameter crosses a safe threshold.
- Feed schedule and consumption tracking — the system schedules feeding per pond and logs exactly how many kilograms of feed were dispensed each session, along with feed type and brand.
- Automatic feed conversion ratio (FCR) calculation — FCR is calculated automatically per pond from total feed divided by biomass gain, flagging early when feed efficiency starts slipping.
- Growth and sampling records per cycle — periodic average weight and size sampling results are logged to project the ideal harvest window and track each pond's growth curve.
- Mortality and disease alert log — daily mortality is recorded per pond along with likely cause, building a history that helps catch outbreak patterns earlier.
- Harvest yield and cost-per-kilogram reporting — every harvest is logged with total weight, sale price, and full operating costs, so production cost per kilogram per pond can be calculated precisely.
- Multi-pond dashboard for owners — a single-screen overview of every pond, making it easy for owners running many units to monitor operations without physically walking the site every day.
Buy an off-the-shelf app or build a custom system
Off-the-shelf aquaculture apps sold as generic products are usually designed for generic cases — fine for a small farm with one or two ponds and simple record-keeping needs. But once operations grow to a dozen or more ponds with different species (vannamei shrimp, milkfish, tilapia), different feeding schemes, and a spread-out field team, generic apps tend to get rigid: alert thresholds can't be customized per species, reports can't be broken down to match the actual business structure, and integration with IoT sensors already installed on site is often limited.
A custom system lets the data structure and workflow be built around how the farm actually operates — including the pond/plot/block hierarchy, stocking-to-harvest cycles that differ across units, integration with automated DO and pH sensors where available, and financial reports that line up directly with the business's own bookkeeping. For farms with more than five ponds, or those managing several locations at once, a custom system investment usually pays for itself faster than continuing to work around the limits of a generic app.
Typical cost and timeline in Indonesia
For a mid-sized farm with standard needs — water quality, feed, growth, mortality logging, and harvest reporting across roughly 5 to 15 ponds — custom system investment typically falls between Rp 70 million and Rp 180 million, with a build time of 3 to 5 months depending on sensor integration complexity and the number of field users. For larger operations with dozens of ponds, multiple farm locations, full IoT integration (automated DO, pH, and temperature sensors feeding data directly into the system), and finance or feed supply-chain modules, investment typically runs Rp 200 million to Rp 480 million with a build time of 5 to 8 months.
Beyond the initial development cost, budget roughly 15 to 20 percent of the investment annually for maintenance — system updates, technical support, hosting, and feature adjustments as the farm's operations grow.
Case study: Tambak Mina Sejahtera, South Lampung
Tambak Mina Sejahtera, a 14-pond vannamei shrimp operation in South Lampung, faced problems much like Pak Hendra's before eventually building a custom pond management system with a development team. Before implementation, their average FCR sat at 1.8 — fairly wasteful by vannamei shrimp standards — and average mortality reached 22 percent per cycle, with at least one significant mass mortality event occurring roughly every two to three cycles due to delayed water quality detection.
Six months after switching to the new system — with automated water quality logging, real-time threshold alerts sent straight to pond supervisors' phones, and per-pond FCR tracking — average FCR dropped to 1.4, close to industry efficiency standards. Mortality per cycle fell to around 11 percent, and since the system went live, there hasn't been another large-scale mass mortality event like before, because early alerts let the team respond within minutes instead of hours. Average harvest yield per pond rose roughly 27 percent over the same period, and production cost per kilogram fell as feed was used more efficiently and losses from sudden die-offs dropped sharply.
Metrics to monitor after implementation
- Feed conversion ratio (FCR) per pond per cycle — the primary feed-cost efficiency indicator, whose downward trend should be tracked over time.
- Mortality rate per pond per cycle — compared against historical averages to catch anomalies early.
- Frequency and duration of water quality threshold breaches — how often parameters like DO or pH cross safe limits, and how long it takes before a response.
- Harvest yield per pond per square meter — to compare productivity across ponds and identify which ones need attention.
- Production cost per kilogram harvested — combined feed, labor, and operating costs divided by total harvest, tracked as a downward trend as an indicator of system efficiency.
Implementation challenges and how to solve them
Field staff used to logging by hand on a wooden board often find a digital system cumbersome at first, especially when they have to type data with wet or muddy hands at the pond's edge. The fix is designing an input interface that's genuinely minimal — ideally a few taps to log a routine reading — paired with hands-on coaching in the field for the first two to four weeks until the new habit sticks, rather than a single day of classroom training.
Data reliability is another challenge, especially when manual input and automated sensors are used together — sensors can drift out of calibration or give false readings from fouling, while manual entries are prone to human error. The fix is building reasonable-range validation into the system itself (rejecting a pH reading that's physically impossible, for instance) and scheduling regular sensor calibration that's logged in the same system, so the calibration history stays auditable.
Internet connectivity at remote pond sites, far from any town, is also a real constraint. A well-built system needs to support offline-first operation, where data logged in the field is stored on the device first and syncs automatically once a signal comes back, so operators never have to wait for a stable connection to finish their daily logging.
Where to start
Building the right aquaculture and fish pond management system starts with mapping the actual field workflow — number of ponds, species raised, team shift patterns, and sensors already installed or planned — before translating that into the data structure and features that get used every single day, not just a generic feature checklist. Check a pricing estimate for your needs, or go straight to submitting a project to consult on your aquaculture system requirements.
Have a similar project?
Free consultation, no commitment. Tell us what you need — we'll help you find the best solution.
Free Consultation